
Report Features
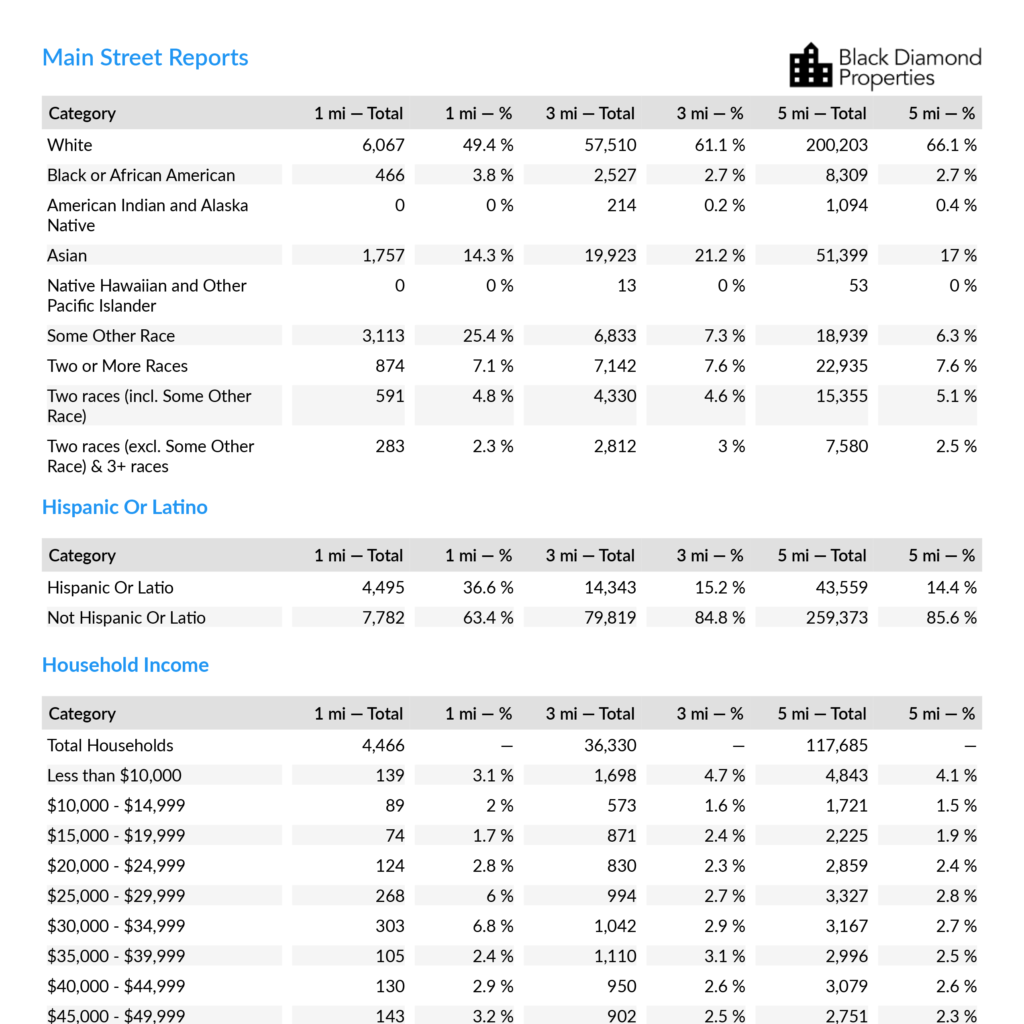
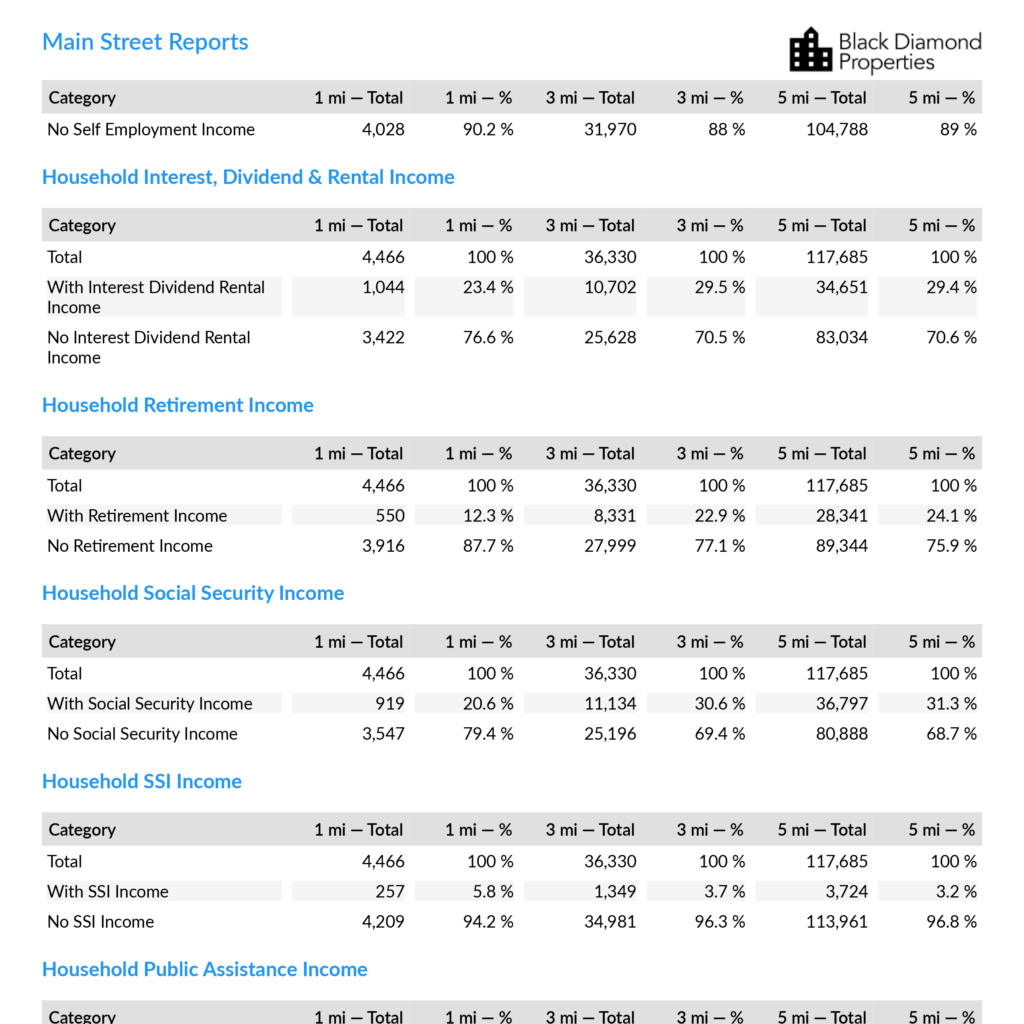
Our demographics reports are filled with the demographic data you need to make intelligent business decisions.
THREE-RADIUS ANALYSIS
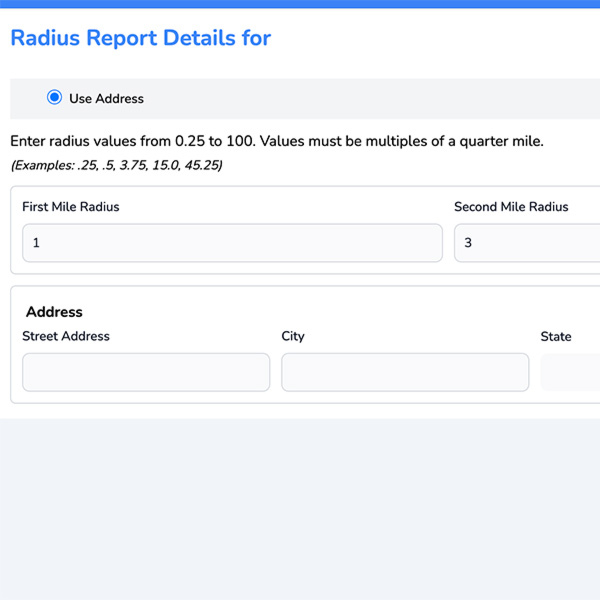
See your market at 1, 3, and 5-mile distances
Most businesses draw customers from different ranges depending on what they’re buying. Coffee shops pull from 1 mile. Restaurants might draw from 3 miles. Specialty services can pull from 5+ miles.
You get all three radiuses in every report, so you can see exactly how your customer base changes as you expand outward. No guessing about market size—just clear numbers for each zone.
PRECISE LOCATION MAPPING
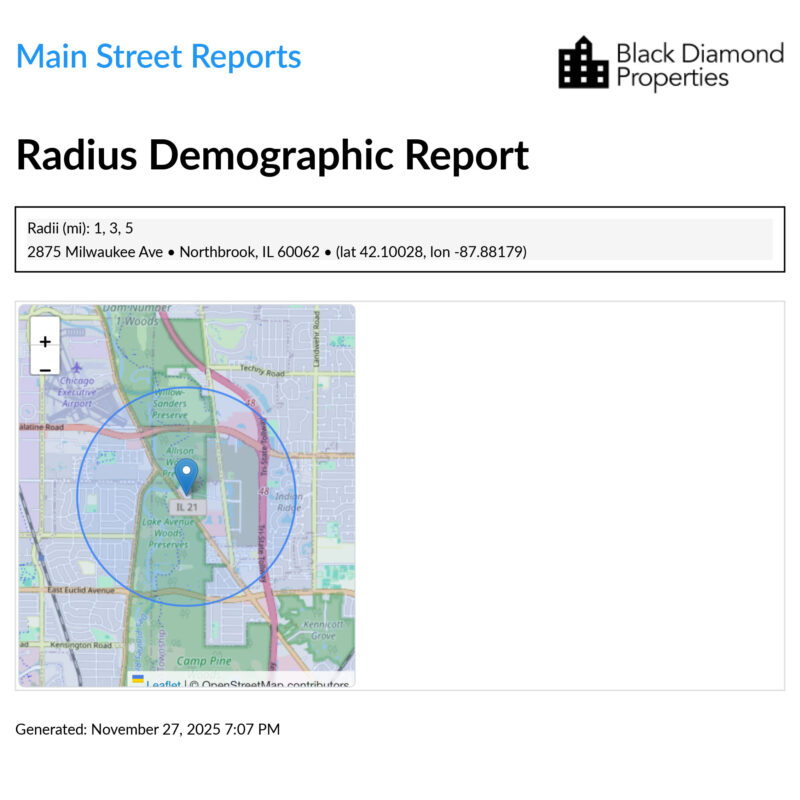
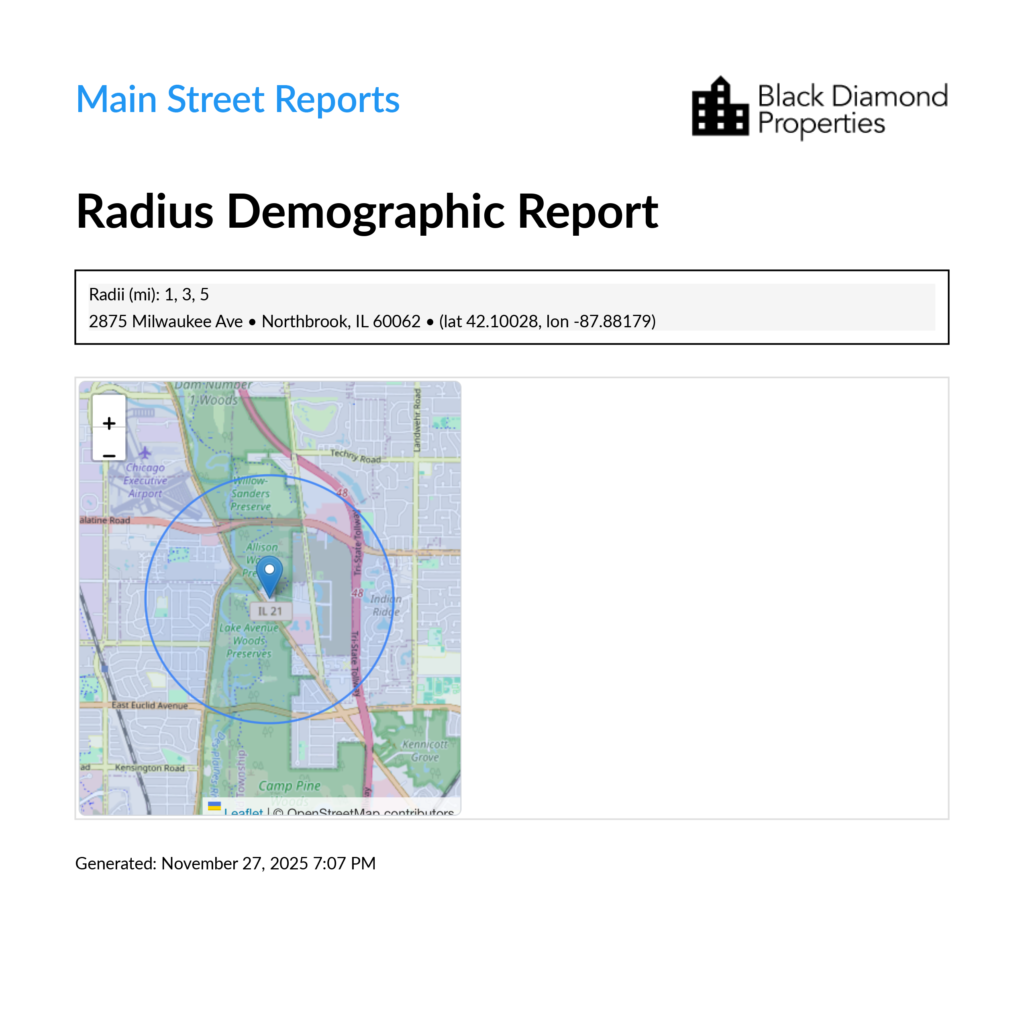
Visual map shows your exact territory boundaries
Every report includes a detailed map with your three radius circles clearly marked. You’ll see major roads, nearby businesses, and how your location fits into the bigger picture.
No more trying to visualize drive times or wondering where your customers will come from. The map shows you exactly what’s within reach.
INCOME & SPENDING POWER DATA
Know what your customers can actually afford
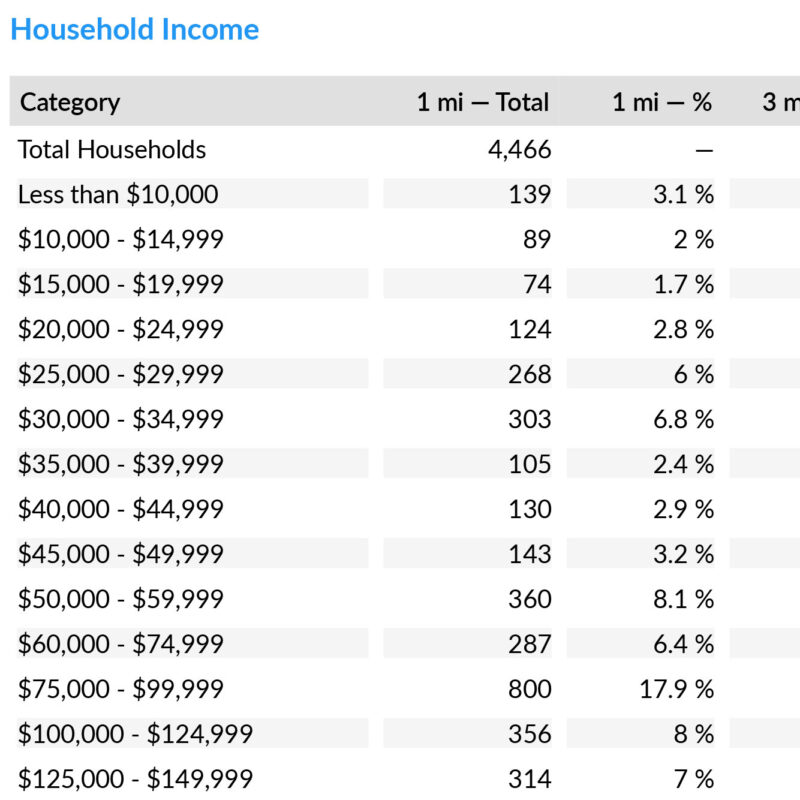
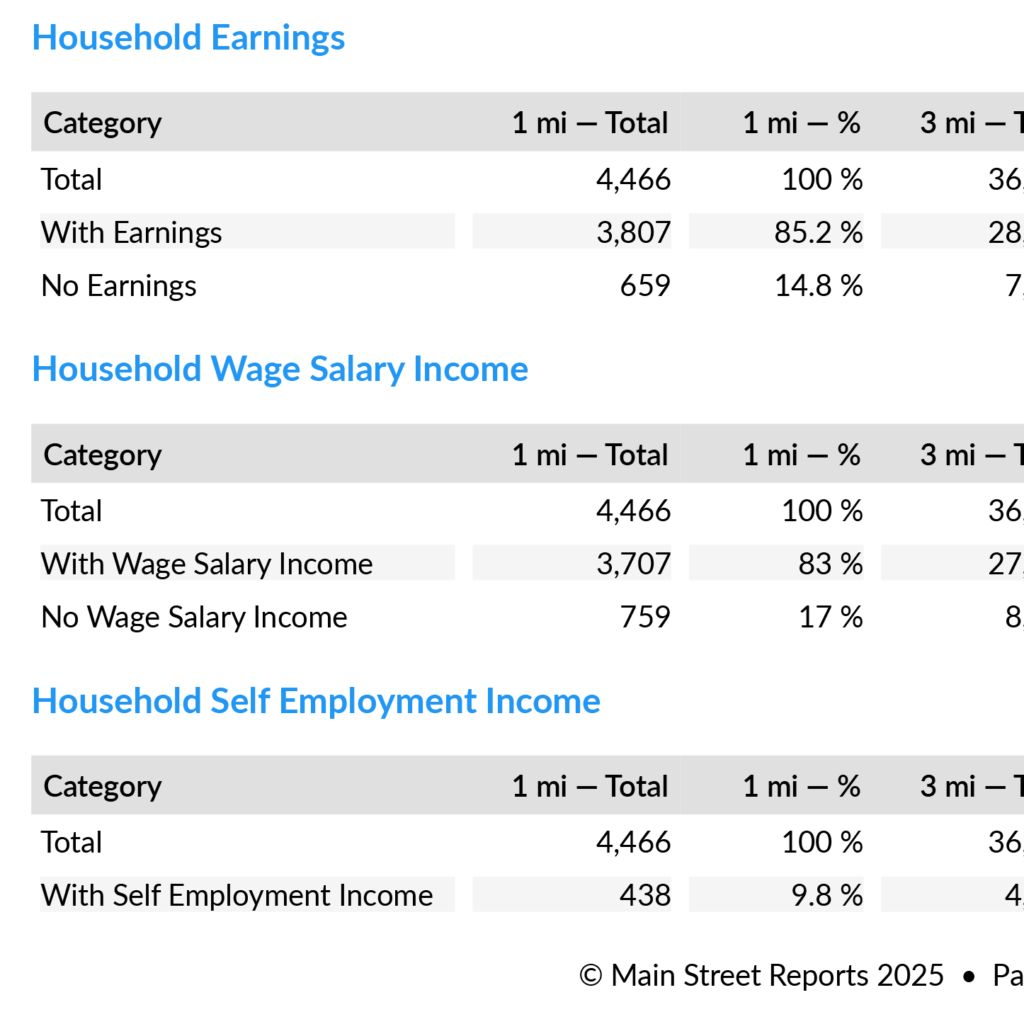
- Average household income by radius
- Income distribution breakdowns
- Spending power indicators
- Economic stability markers
Stop wondering if your market can support your pricing. The income data tells you exactly what your customers earn and what they can spend.
NEIGHBORHOOD COMPOSITION
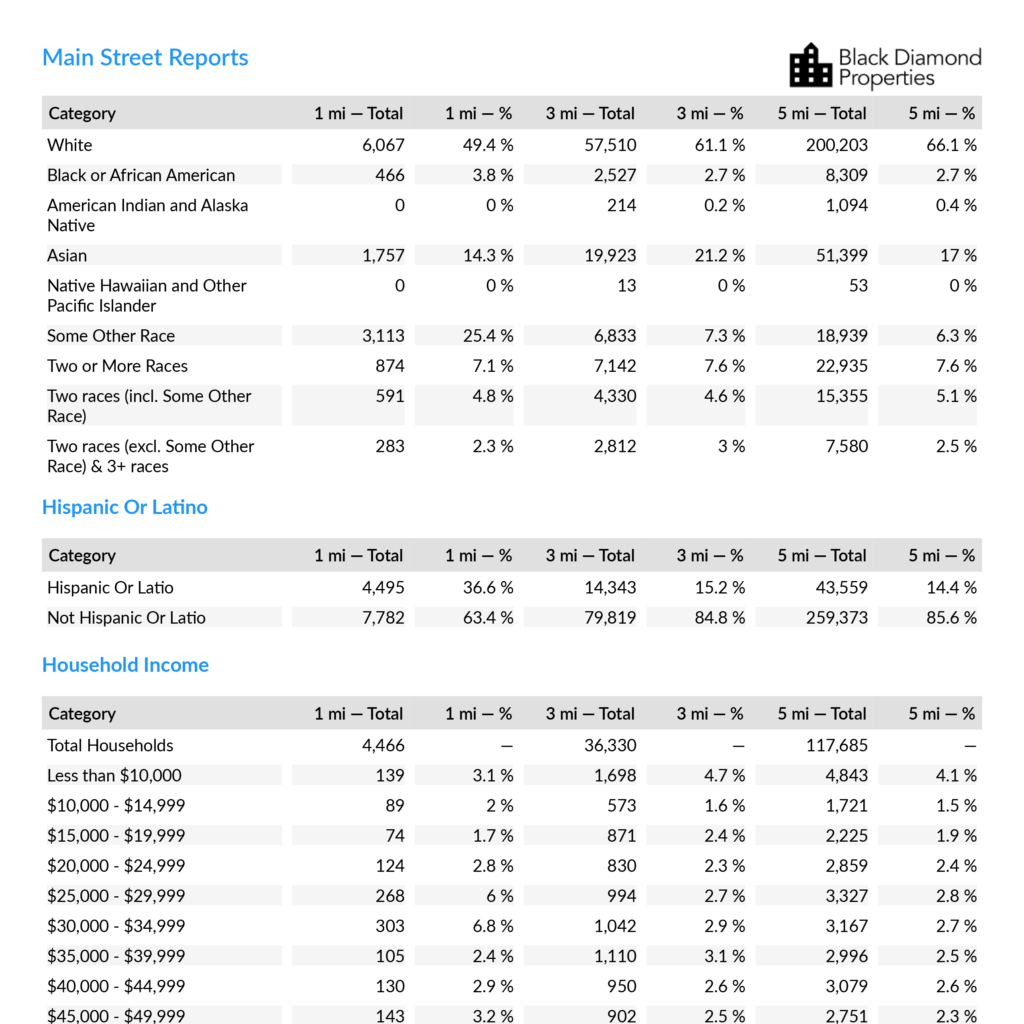
Get the full demographic picture
Every report includes a detailed map with your three radius circles clearly marked. You’ll see major roads, nearby businesses, and how your location fits into the bigger picture.
No more trying to visualize drive times or wondering where your customers will come from. The map shows you exactly what’s within reach.
POPULATION & HOUSEHOLD ANALYTICS
Understand who lives in your market area
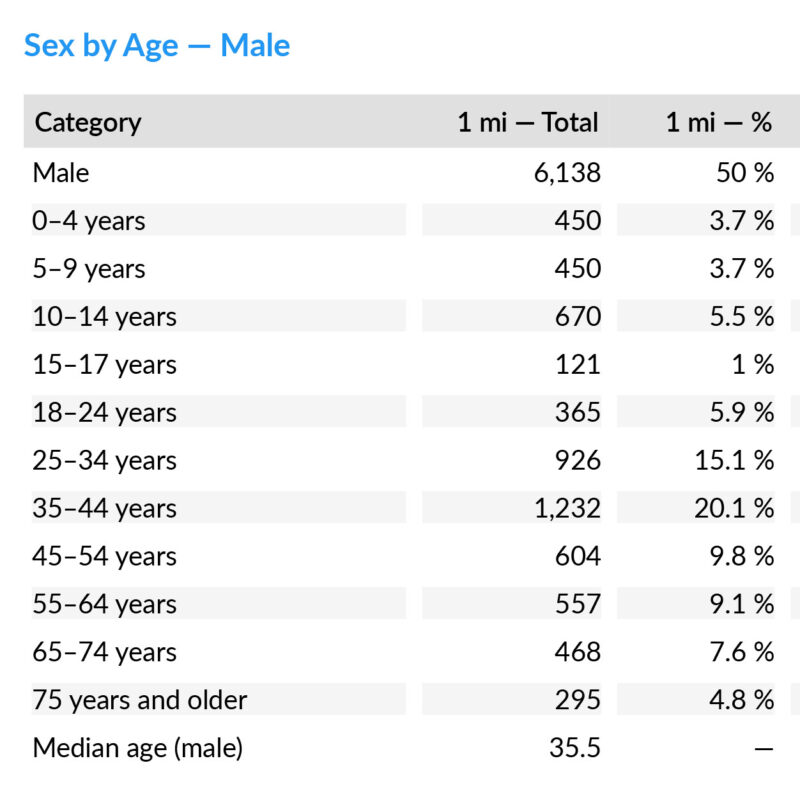
- Detailed age breakdowns (not just averages)
- Household type analysis
- Population density insights
- Market stability indicators
This isn’t just basic census data—it’s organized to answer the real questions about whether your business concept fits the local market.
CLEAN, PROFESSIONAL PRESENTATION
Data you can actually use and share
Every report comes formatted for easy reading and sharing with partners, investors, or franchise corporate teams. No confusing charts or buried numbers—just clear, actionable information.
- Professional layout ready for presentations
- Key metrics highlighted and explained
- Easy-to-scan format saves you time
- Printable and shareable PDF format
INSTANT DELIVERY
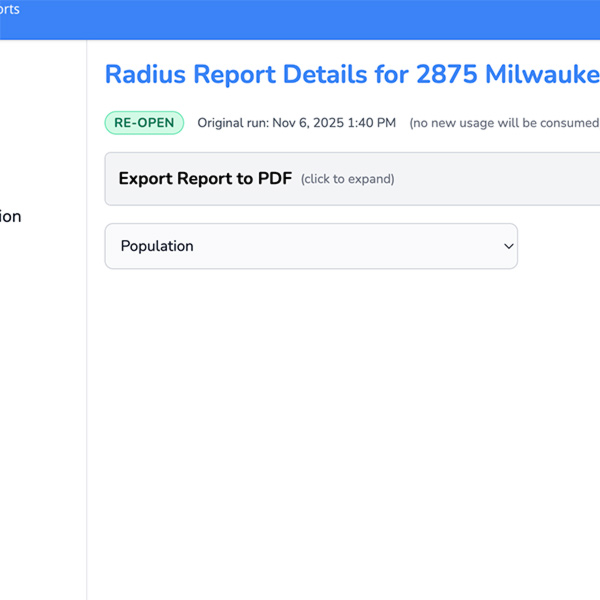
Get your report in minutes, not days
Enter any address in the United States and get your complete demographic analysis immediately. No waiting for custom research or paying for expensive consulting studies.
What used to take weeks of research and thousands of dollars now takes minutes and costs less than dinner for two.
FRANCHISE-FOCUSED INSIGHTS
Built specifically for business location decisions
This isn’t generic census data dumped into a pretty format. Every data point is chosen and presented to help you make smart location decisions faster.
- Market size calculations for business planning
- Customer profile summaries for concept matching
- Competitive landscape context
- Growth and stability indicators
WHY THESE FEATURES MATTER
For Franchise Owners: Know your territory demographics before you sign the lease, not after.
For Real Estate Agents: Give clients the market data that actually influences their business decisions.
For Business Consultants: Skip the research phase and jump straight to strategic recommendations.
For Investors: Validate market assumptions with real numbers before writing checks.
READY TO SEE YOUR MARKET CLEARLY?
Every feature above comes standard in every report. No add-ons, no premium tiers, no hidden costs. Just complete demographic intelligence for any address in America, delivered instantly.
Because making smart location decisions shouldn’t require a PhD in demographics or a month of research. It should take about five minutes and give you everything you need to move forward with confidence.
Get your demographic report now and stop guessing about your market.
As a business or franchise owner, get a
wide angle view.
Provide them with something special, show them demographics specific to the property location.

Population Data
To have a successful business, you must know your audience — your local population metrics — inside and out.
- Age — Is your market mostly college-aged, in their 30s, 40s, or 50s?
- Sex — Learn which target markets are predominantly male or female
- Race — Discover the ethnicity landscape of your area
- Marital Status — Single, married or divorced
- MORE than 300+ data points available

Housing Data
If you’re a real estate agent, property investor, or franchisee business that targets homeowners, the data points in our reports can provide the insight you need to determine the market’s potential. Our housing reports contain more than 300+ data points!
- Household Average Size — Average number of kids per household
- Household Type — Single-family home, apartment, condo, etc.
- Average Age of Homes — Newer neighborhoods or aging subdivisions
- Mortgage Status — Are there many foreclosures or do people pay on time?
- House Value – How much are houses worth in the area?
- Rental vs Ownership

Economic Data
Every neighborhood has an economic pulse. It’s important to potential homeowners and businesses alike to understand what the economic activity is and how they can benefit. Economic activity can give you the big picture before investing in a new franchise or becoming a new homeowner.
- Household Income — How much disposable income do they have for your products or services?
- Travel Time to Work — How long are people spending on travel each day?
- Number of Vehicles
- Occupation — Professional Services, Manufacturing, or Agriculture, what drives the local economy
What is Main Street Reports?
Main Street Reports has made demographic reporting for the real estate market easy. Forget trying to source population data from this website and that website. We’ve already done the heavy lifting pulling together the US Census data and American Community Survey (ACS). Don’t understand spreadsheets, calculations, formulas, ugh. Don’t waste time searching for how to do this or that, we’ve taken care of it. Our demographic reports are loaded with summaries, percentages and line items. Everything you need.